Everybody’s talking about “big data” and what it can do to transform business. It’s really exciting to think about how we can knit together disparate data sources and analyze more data than ever. However, more often than not we see companies neglecting their fundamental business data and the value it can provide for this business.
It’s time that we democratize “small data” – the mundane, run-of-the-mill data that already exists in your business. What do you and your team do every day to make the most of that data? For example…
- Does your CFO produce visual reports that are easy for anyone to understand (v. standard accounting reports that confound most people and require a CPA to decipher)?
- Do your executives and managers know how to use the company’s financials to guide their decision-making? Are they rewarded for it?
- Do you know the profitability of every product, customer and market segment in your portfolio? And, do you use this information to make better decisions about your next move?
If you can answer yes to any of these questions, you are in the minority. If you can’t answer yes to these questions – what are you waiting for? Hidden value is just waiting to be unlocked in your business. Help your employees digest and democratize your company’s “small data” and unleash better decision-making and better results.
Of course, having the data is merely the first step. The average person can’t make much sense of accounting or finance-geek reports. So, we recommend that you find ways to visualize the data to unleash its full potential. There are tons of tools out there to help you visualize your data – big and small. Check out the tools available on Tableau or Longview. Or, just kick it old school and use excel or powerpoint to get the message across.
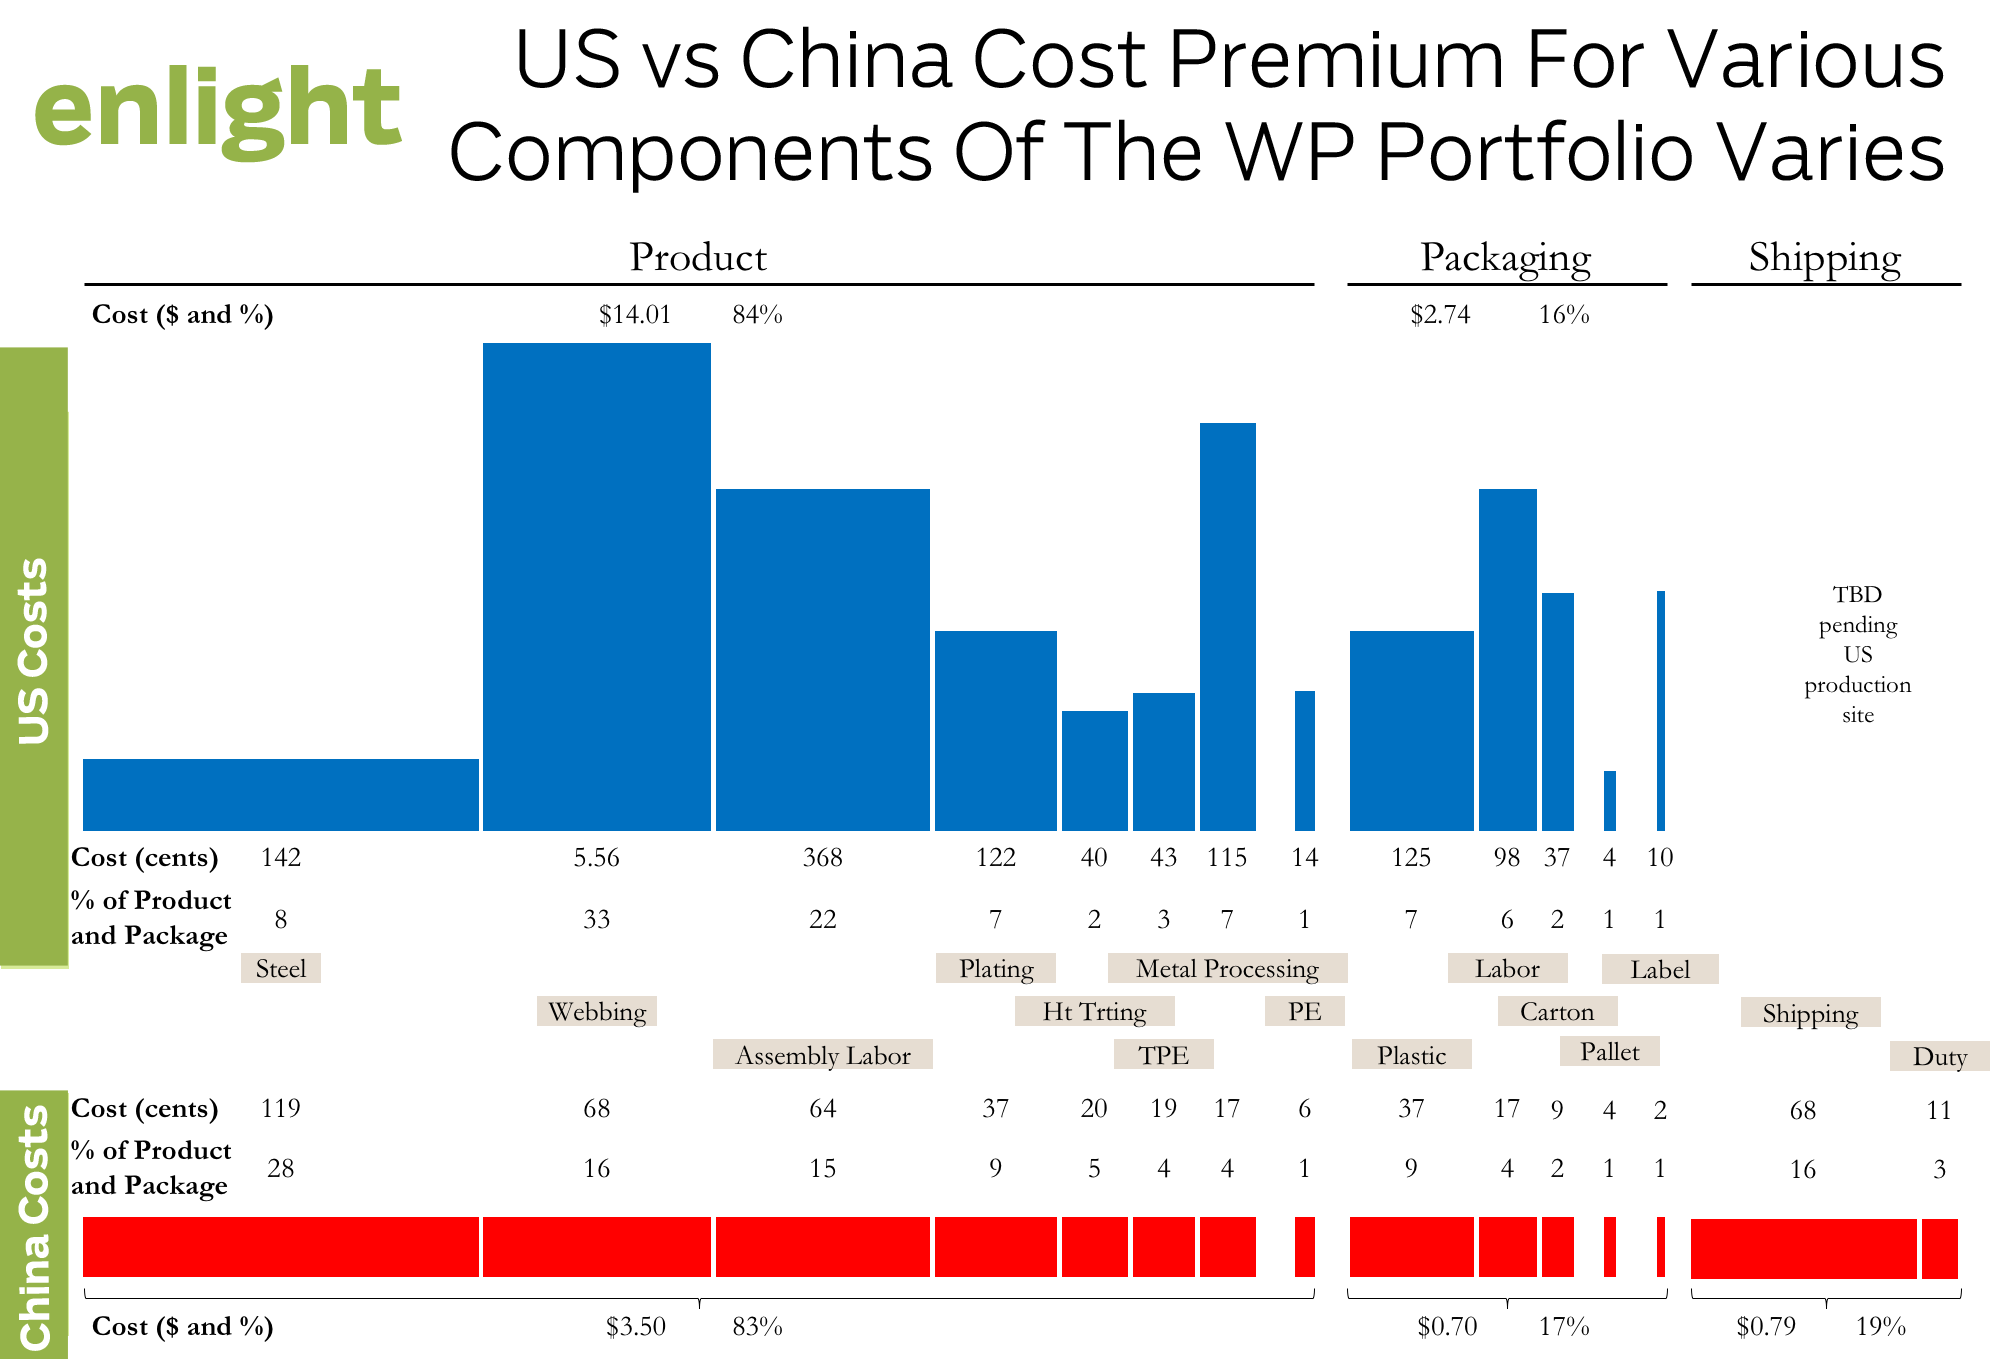
Here’s an example of how we helped a client understand their cost structure to determine how to near-shore production from China:


